I just got a license for NDepend to get an opportunity to test it with VS 2019 Community. My first impression is positive. The intro video is quite useful to know how to start as first what I was trying to do after installation is to look after option in SLN context menu to run an analyze. Nope, it is not working this way. From VS menu you have to choose NDepend -> Attach New NDepend Project to Current VS Solution (a small tip here to NDepend team – using capital letters for each word does not look friendly especialy that all other options looks “normal”).
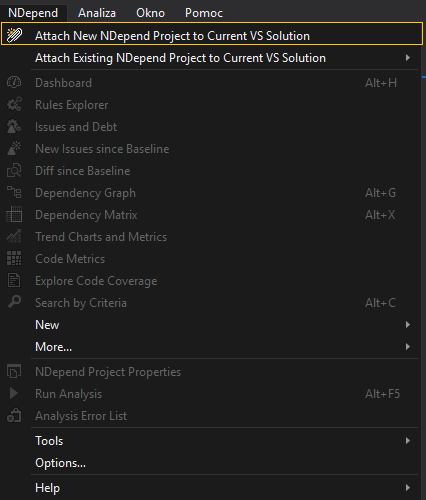
Another thing which I realized is missing localization. I am using VS in Polish and as you can see the menu is in English (and I do not expect to have it in Polish, just paid my attention).
Unfortunately from my projects I have only projects with small code base. So after short research I find a bit bigger solution on github (CleanArchitecture). This project has quite lot of stars and followers.
Tool is quite fast – on my laptop which is not speed deamon it took 22 seconds to generate basic report.
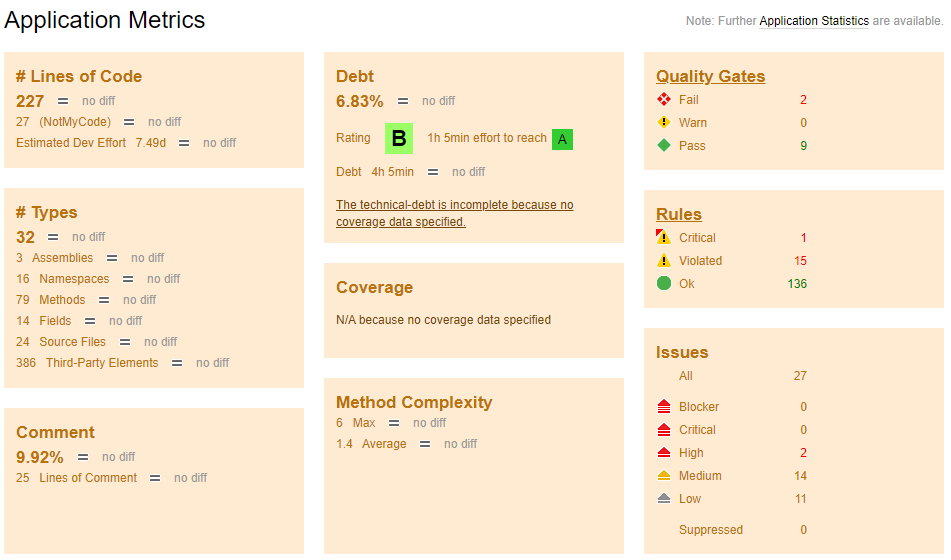
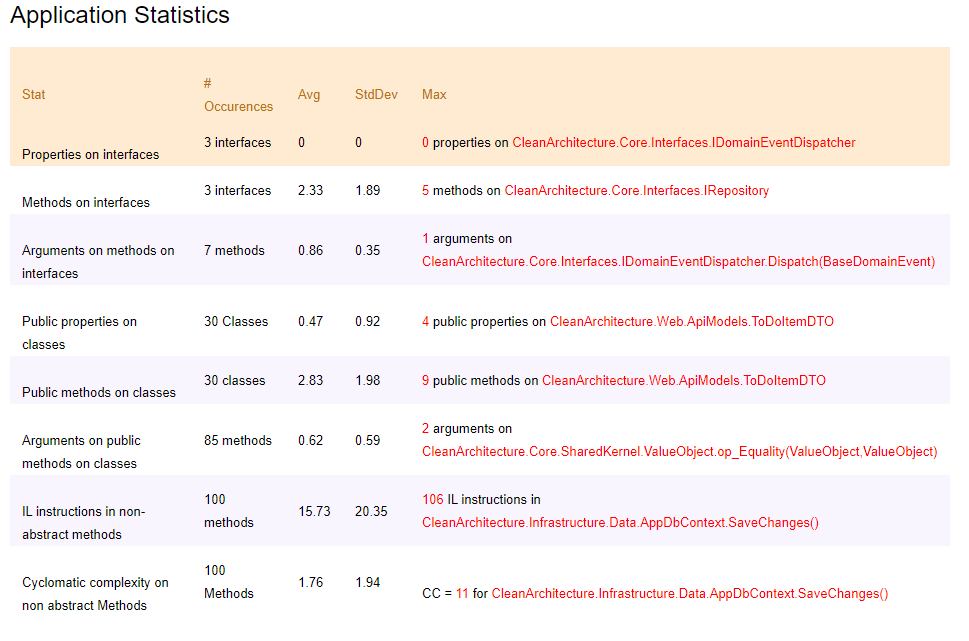
Comparison between versions
When I downloaded newer code version (after a month) I was able to test comparison between version. It is quite readable.
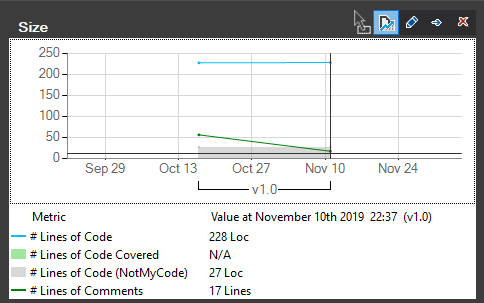
Quite interesting is chart after exporting to HTML (it is interactive).
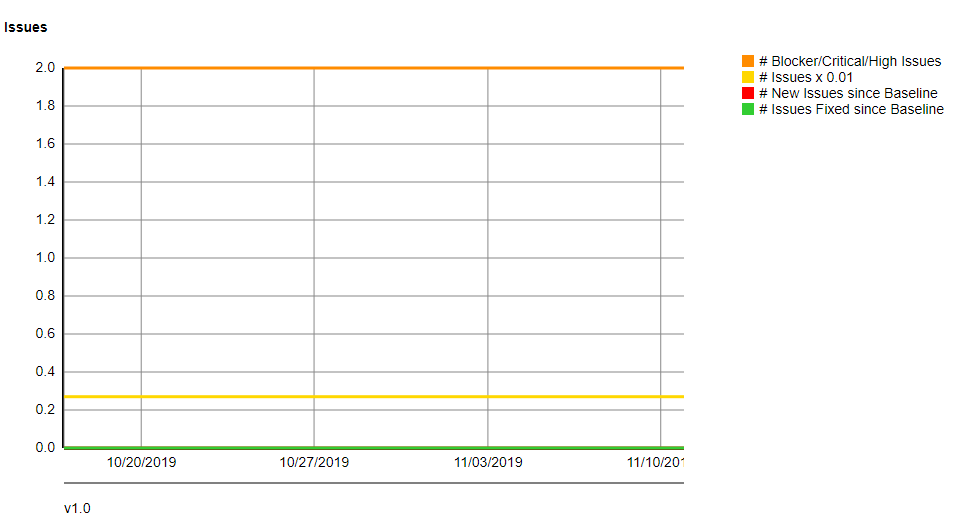
Default dashboard (in VS) offers following charts:
- % Coverage and % Debt
- Issues
- Rules
- Quality Gates
- Debt
Also the dashboard offers an option to create a trend chart with many options (73!).
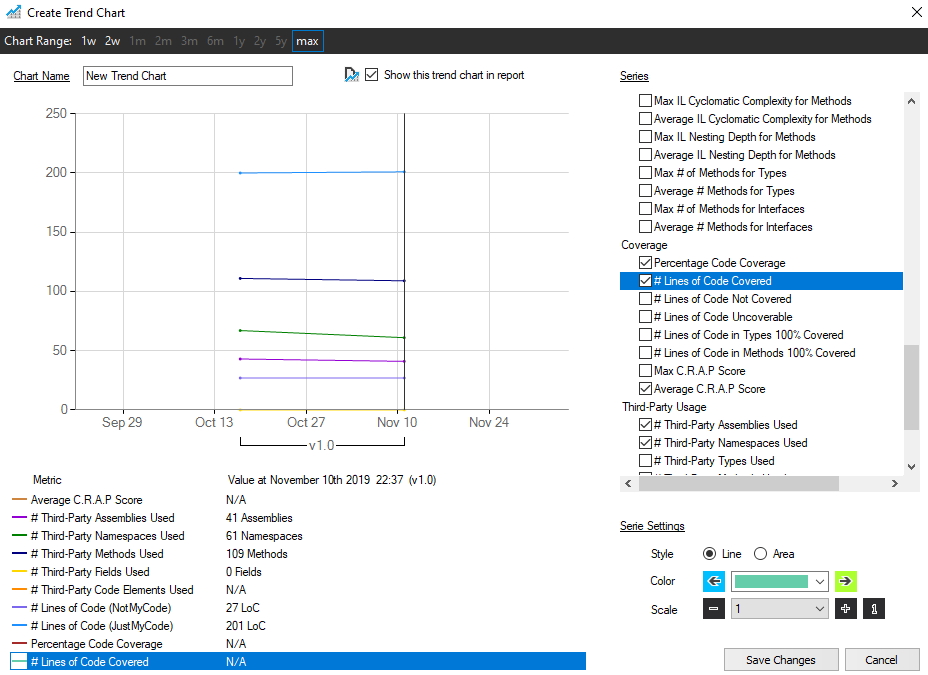
Custom trend chart has a long list of possible selections (see above screen short – the list is really long). Also chart colors are customizable.
Code metrics
NDepend can also show different metrics like:
- code coverage – only displaying data from OpenCover
- relational cohension
- abstractness
- lines of code
and maaaaaany more. These data can be presented on various levels (aseembly, namespace, type, method, field). Depending on the level selection, various options are available in next drop downs.
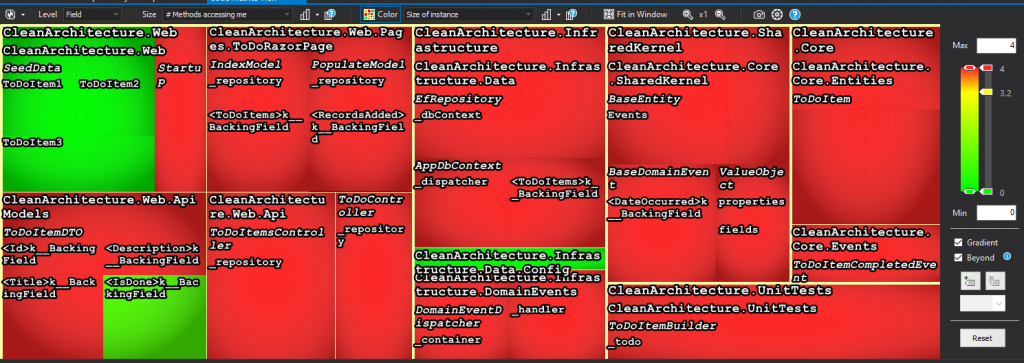
Following that I selected Assembly, lines of code and namespaces. After selecting one of visualized components, I got usefull data (see screenshot below).
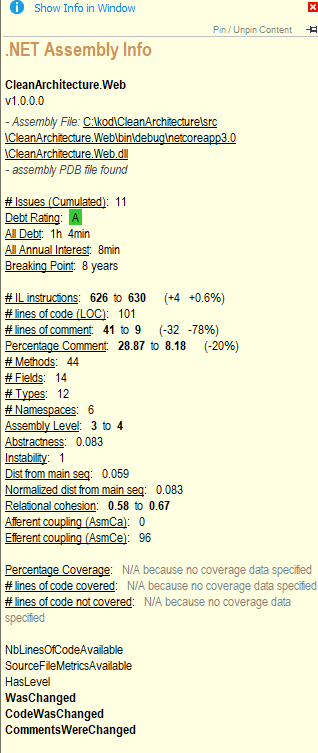
I did not dived deep into some of them but they looks quite interesting. For example Breaking Point. I had no clue what it means, fortunately the tool came with a support – when I clicked on it, the link opened help with explanation (the link = URL to NDepend site where is manual describing calculated metrics in details).
Also this view is able to show the difference between versions.

From all the metrics the most important are:
- quality gates
- debt (rating and estimated time to fix)
- code coverage
They are helping the most to identify potential gaps in code quality. “Potential” as in some conditions it might be false alert as we cannot implement the functionality in different way due to various limitations (technical or specification or just timeline and technical debt is intentional).
Summary
This tool is worth to consider if you don’t have already similar one in the project. It gives a lot of useful information so at least I would install it on the build server to follow selected metrics (quality gates, technical debt, code coverage). From my experience it is important in larger projects to ensure that all team members are keeping desired product quality.
- Good
- Performance (speed of analysis)
- Comparing different versions
- Custom trend charts
- Various metrics
- Can be used with VS and with build server
- Good support page with explanation to metrics
- To improve
- Calculating code coverage not embedded
- HTML report color schema is acceptable however it could be more contemporary
Visit NDepend site if you are interested in this tool.
PS In this test I used not the latest version (2019.2.7 vs the latest today is 2019.3.0) as the difference is very minor.